
Case Study
Scalable PDP Infographic Templates
Project Overview
To enhance clarity and visual appeal on product detail pages (PDPs), we launched an initiative to create a scalable library of infographic templates. These assets were designed to clearly communicate key product features, specifications, and benefits in a visually engaging, brand-aligned format. As our catalog continues to grow, this system ensures both consistency and creative flexibility.
The Challenge
Existing designs were:
Inconsistent across product types
Time-consuming to produce
Visually disjointed and off-brand
We needed a system that would allow our team to quickly and consistently create high-end visuals that support both education and conversion.
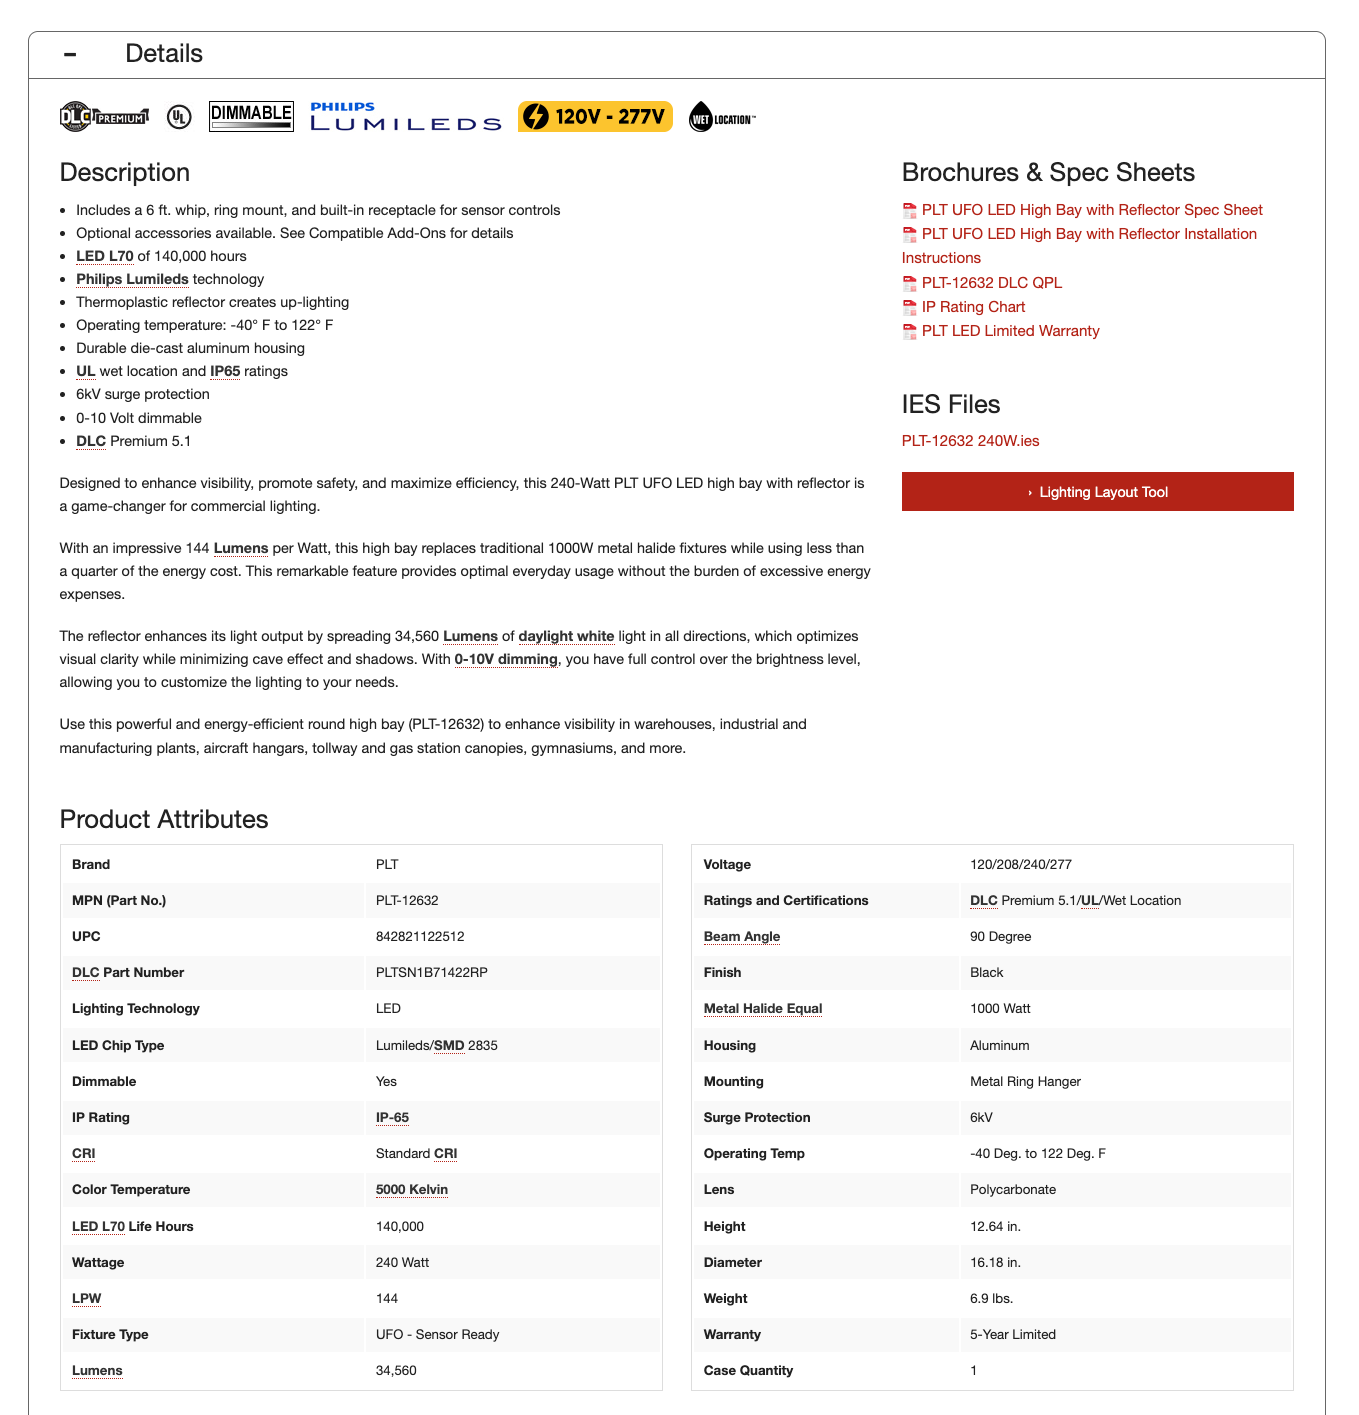
Other than product photos, PDPs were text-heavy and visually sparse. Before implementing our infographic system, PDPs relied solely on dense technical copy and feature lists. Without visual aids, critical selling points were often overlooked—creating friction for customers and missed opportunities to engage.
The Solution
We developed a flexible, templatized infographic system, designed to visually communicate complex product attributes in an approachable, scalable format. The initial rollout included templates for:
IP Ratings
Key Features
Application Use Cases
Mounting Charts (e.g. High Bay)
Motion Sensor Savings
Color Temperature Scales
Beam Angles
Daylight Harvesting
Benefits of LED
Bulb Base & Shape Charts
CRI, Warranty, Shatter Resistance, and more
My Role:
Led the creative strategy and framework for the template system
Assigned and reviewed execution by the design team
Ensured brand alignment, visual consistency, and creative scalability
This infographic template visualizes the full Kelvin scale, highlighting the product’s specific color temperature—or range, in the case of selectable products. Rather than pre-rendering every possible variation, our designers can easily generate custom combinations on demand using the project file—ensuring visual accuracy for any new product without starting from scratch.
The Impact & Results
The new infographic system had a major impact on both team efficiency and user experience:
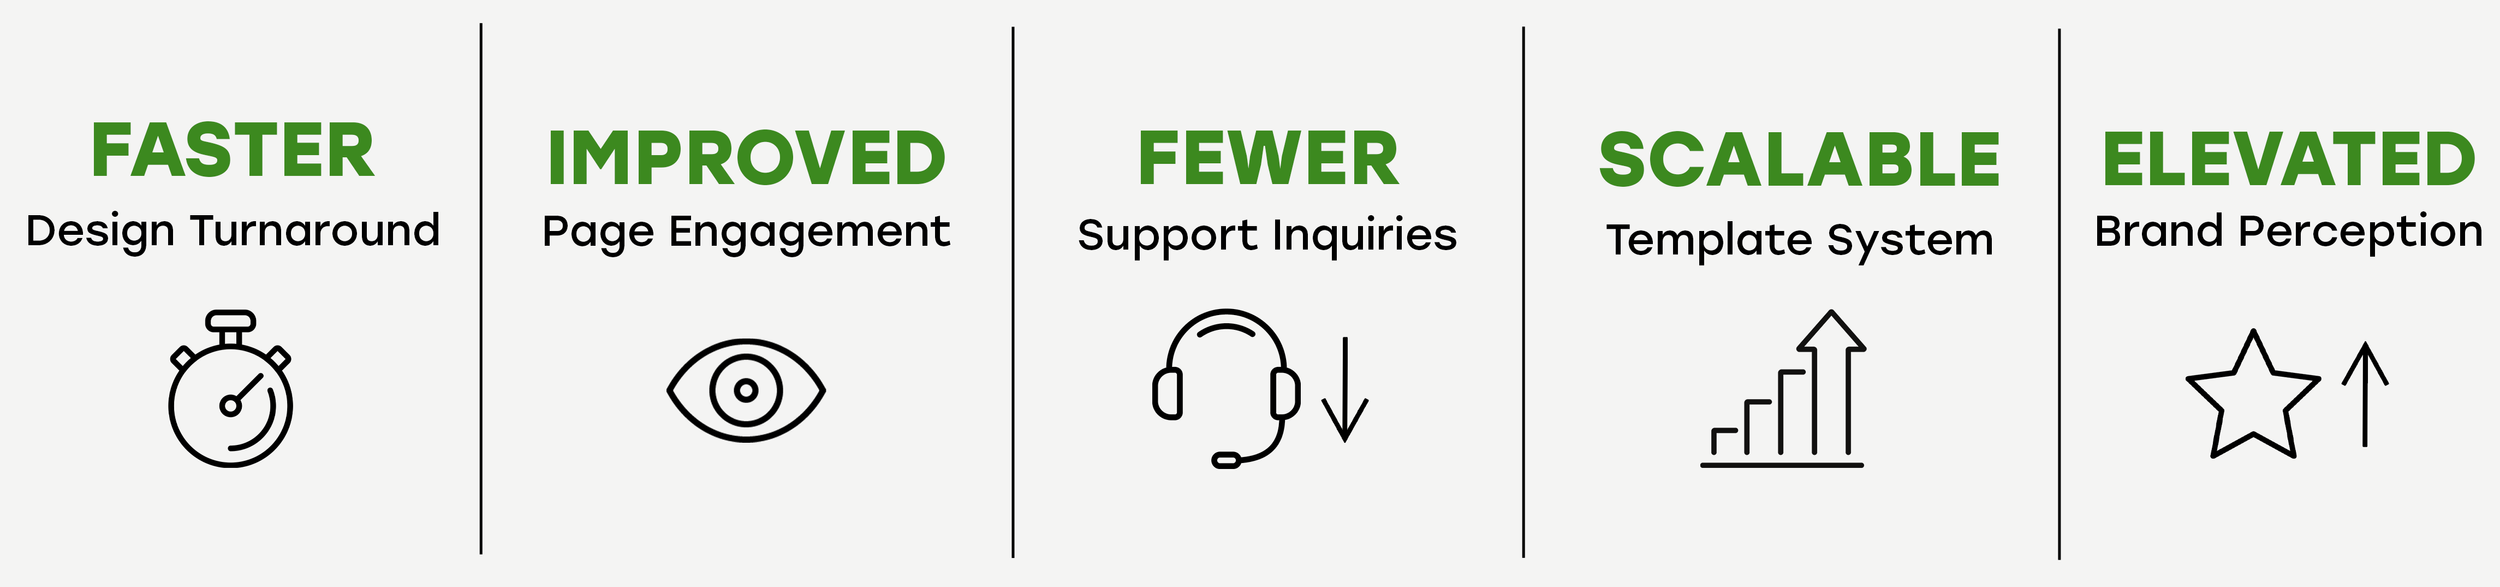
Infographic production time dropped from days to hours (or even minutes)
Reduced revisions and internal back-and-forth between teams
Positive feedback from merchandising and publishing teams on clarity and polish
Praised by leadership as a significant brand elevation tool
Designers now work faster with more consistency
Improved time-on-page and lower bounce rates on PDPs with infographics
Customer service received fewer product-related inquiries
Improved customer understanding of product differences
Faster, more scalable rollout of visuals for new product lines
New content types are now built on top of this system
The balance of ease-of-use and customization has unlocked long-term value
Final Takeaway
This infographic system proved that high-end visual storytelling doesn’t have to come at the expense of speed or scale. It established a new visual standard across our product pages while empowering our design team to move faster, work smarter, and support the customer journey more effectively.
Let’s chat.
Have a project in mind? Curious about my work? Or simply want to connect? Fill out the contact form, and I'll get back to you as soon as I can. Regardless of the reason, I appreciate your visit!
Talk
Connect with me on LinkedIn.